NODF nestedness worked example
The purpose of this blog post is to work through the example in Almeida-Neto et al. (2008) for calculating the NODF nestedness metric.
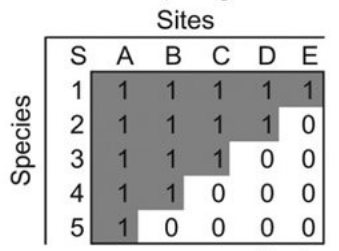
We’re interested in a species-site presence-absence matrix, which is a binary matrix with rows corresponding to species, columns corresponding to sites, and the presence of a species at a site represented by a 1. In a perfectly nested matrix, the sets of species at the sites and the sets of sites at which a species is present form proper subsets of each other. The figure below shows an example of a perfectly nested matrix.

An example of a perfectly nested presence-absence matrix
Matrices are rarely perfectly nested, so ‘nestedness’ measures the degree of nestedness or how closely a matrix comes to being perfectly nested. The degree of nestedness doesn’t have a specific definition, and so there are many metrics of nestedness in the literature.
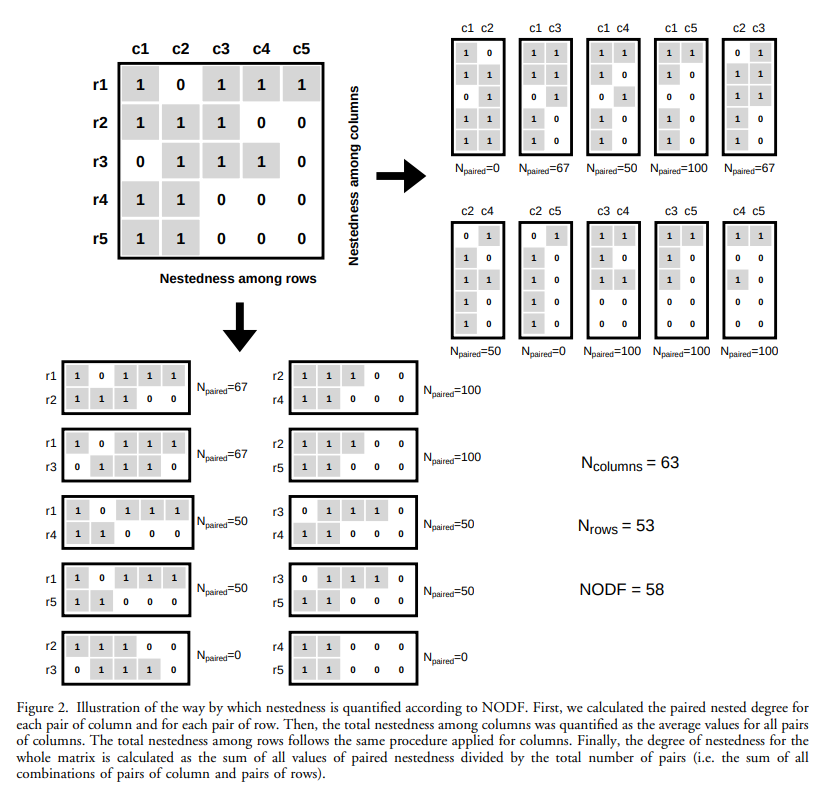
Almeida-Neto et al. (2008) defines the popular NODF nestedness metric and provides an example of how to calculate it. The metric is based on two properties we associated with a perfectly nested matrix: (1) decreasing fill, which means the rows below and columns to the right should have fewer 1s in them than rows above and columns to the left; and (2) paired overlap, which reflects the idea that a 1 that appears in the rows below and columns to the right should also appear in the rows above and columns to the left. The Almeida-Neto et al. (2008) metric averages the combination of these two properties across all pairs of an upper and lower row and a leftward and rightward column. When comparing a pair, if decreasing fill is not satisfied, then that pair contributes 0 towards the total nestedness. Otherwise, the pair’s contribution is the percentage overlap in 1s between the two rows or two columns.

The example NODF nestedness calculation from Almeida-Neto et al. (2008)
The figure above shows the example Almeida-Neto et al. (2008) used, and we’ll write some code in the iPython console to do the calculations. Here, I am following the approach used in the code provided in Strona et al. (2018).
The first step is to define the presence-absence matrix
In [112]: import numpy as np

In [114]: M = np.array([[1, 0, 1, 1, 1],
     ...:               [1, 1, 1, 0, 0],
     ...:               [0, 1, 1, 1, 0],
     ...:               [1, 1, 0, 0, 0],
     ...:               [1, 1, 0, 0, 0]])
     ...:
We’ll work on the rows first. For each row in the matrix, find the set of column indices with a 1.
In [115]: row_idxs = [ set(np.where(i == 1)[0]) for i in M ]

In [116]: row_idxs
Out[116]: [{0, 2, 3, 4}, {0, 1, 2}, {1, 2, 3}, {0, 1}, {0, 1}]
We want to compare every pair of rows with one upper row and one lower row, so generate a list of these pairs
In [117]: import itertools as it

In [118]: row_pairs = list(it.combinations(row_idxs, 2))

In [119]: row_pairs
Out[119]:
[({0, 2, 3, 4}, {0, 1, 2}),
 ({0, 2, 3, 4}, {1, 2, 3}),
 ({0, 2, 3, 4}, {0, 1}),
 ({0, 2, 3, 4}, {0, 1}),
 ({0, 1, 2}, {1, 2, 3}),
 ({0, 1, 2}, {0, 1}),
 ({0, 1, 2}, {0, 1}),
 ({1, 2, 3}, {0, 1}),
 ({1, 2, 3}, {0, 1}),
 ({0, 1}, {0, 1})]
For each upper (u) and lower (l) row pair,
we calculate the percentage overlap in column indices that contained a 1,
\(N_{\text{paired}}\).
We can calculate this by calculating the size of the set that
is the intersection (operator &) of the two sets of indices.
However, if there is not decreasing fill between the upper and lower row,
i.e., the set of indices for the lower row is longer than for the upper row set,
then \(N_{\text{paired}} = 0\).
In [120]: Np_row = [ 0 if len(l) >= len(u) else 100*len(u & l) / len(l) for u, l in row_pairs ]

In [121]: Np_row
Out[121]: [66.7, 66.7, 50.0, 50.0, 0, 100.0, 100.0, 50.0, 50.0, 0]
We’ll do the same thing for the columns
In [122]: col_idxs = [ set(np.where(i == 1)[0]) for i in M.transpose() ]

In [123]: Np_col = [ 0 if len(l) >= len(u) else 100*len(u & l) / len(l)
     ...:                                 for u, l in it.combinations(col_idxs, 2) ]
     ...:

In [124]: Np_col
Out[124]: [0, 66.7, 50.0, 100.0, 66.7, 50.0, 0.0, 100.0, 100.0, 100.0]
NODF is the average over the rows and columns
In [125]: NODF = np.mean(Np_row + Np_col)

In [126]: NODF
Out[126]: 58.3
References
Almeida-Neto, M., Guimaraes, P., Guimaraes Jr, P. R., Loyola, R. D. and Ulrich, W. (2008). A consistent metric for nestedness analysis in ecological systems: reconciling concept and measurement, Oikos 117(8): 1227–1239.
Strona, G., Ulrich, W. and Gotelli, N. J. (2018). Bi-dimensional null model analysis of presence-absence binary matrices, Ecology 99(1): 103–115.