Network structural uncertainty in Qualitative Modelling
Background
Imagine a situation in which we want to model the behaviour of a food web, but we don’t know what the species interaction strengths are, and we’re not 100 percent sure what the structure of the food web is, either. For example, in the figure below, experts are are uncertain about whether or not there is a direct interaction between species 4 and 5, and so both structures 1 and 2 are possibilities. We want to know, which of these candidate structures is more likely to represent the true network structure?
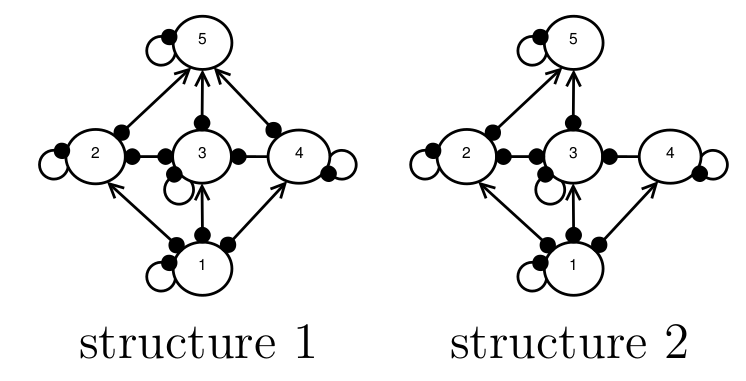
An example of network structural uncertainty. Experts are uncertain as to whether or not species 4 and 5 interaction, therefore both network structures 1 and 2 are possible.
Melbourne-Thomas et al. (2012) developed a method for resolving this kind of network structural uncertainty using past observations the species’ responses to press-perturbations. A press perturbation is a constant addition or removal of individuals that moves the population sizes to a new steady state (Yodzis, 1988). For example, if species 5 was previously the subject to a pest-control programme, where 100 individuals were culled each year, then this could be modelled as a press perturbation (Nakajima, 1992). If the population size of species 3 was observed to increase in response to the pest-control programme, then this could be used as data for the Melbourne-Thomas et al. (2012) approach. Note that here we are invoking the `near-equilibrium assumptions’ (Abrams, 2001; Justus, 2006): the population dynamics for all species are assumed to be at steady state, and the press-perturbation is assumed to be small enough that the linearisation of the dynamics around the steady state, used in (Nakajima, 1992), gives an adequate approximation.
The Melbourne-Thomas et al. (2012) method is a Bayesian method, which calculates the likelihood that each candidate structure can reproduce the past observation. The likelihoods can be estimated using Monte Carlo simulations. The Monte Carlo simulations involve randomly sampling species interaction-strengths to find out which network structure reproduces the past behaviour with the highest probability. For example, if we found that 90% of randomly-parameterised models with structure 1 reproduced the past response, but only 50% of models with structure 2 reproduced the past response, then we would conclude that structure 2 is more likely to be the true structure.
The first difficulty with this approach is that it can run into the problem of the Principle of Indifference. The distribution used for randomly sampling the interaction-strength values represents a prior. In the situation where the interaction strengths are completely unknown, they recommend the use of a uniform prior. I’ve written about the Principle of Indifference in a previous post here. In short, there may be multiple ways to formulate the model and describe the parameter space of the unknown interaction strengths, and applying a uniform prior to these different parameter spaces will produce different likelihoods.
In this blog post, however, I want to set aside the Principle of Indifference problem and focus on two other aspects, which I believe apply whether or not an uninformative prior is used. These two aspects hinge on two generalisations. First, the less structurally complex an interaction network is, the fewer the number of species-response combinations that it can produce. Second, the fewer the number of species-response combinations, the higher the `probability’ (e.g. in Monte Carlo simulations) of each occurring. As a consequence of these generalisations, I expect that the method will do three things. First, I expect that it will favour candidate structures with lower structural complexity. Second, when the favoured structure is used to make predictions, then because of its lower structural complexity, it will predict fewer species-response outcomes. Third, each of those species response will be predicted with higher `probability’, which in a probabilistic Qualitative Modelling framework (e.g. Raymond et al., 2011) will be interpreted as indicative of higher evidential support.
A thought experiment
Consider the hypothetical situation in which every possible network structure is a candidate, and we have a past observation: a positive perturbation of Species A resulted in a positive response in Species B, a positive response in Species C, and a negative response in Species D. Given that the species responses to a press-perturbation responses in a food chain are fully determined (see post here), then the Melbourne-Thomas et al. (2012) method will assign the food chain structure shown in the figure below a likelihood of 1. Further, if this chain structure is then used to predict the species responses to some future management intervention, then it will assign all of its predictions with the highest possible level of evidential support: a probability of 1.
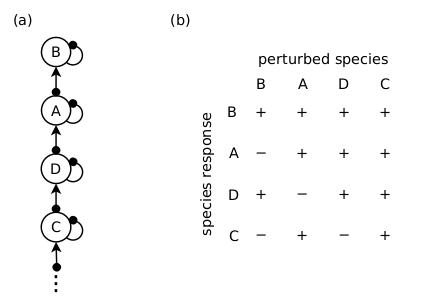
A food chain structure (a) has a likelihood of 1 of producing the past observed responses (see text). It predicts the species responses in (b) with probability 1.
A more realistic example
The thought experiment above is an extreme case, and the idea that QM practitioners might erroneously choose chains to describe every ecological network is absurd. However it does a good job of illustrating how the method may be biased towards structurally simpler networks. The next step is to see if this holds true for more realistic network structures.
In their paper, Melbourne-Thomas et al. (2012) demonstrated the utility of their method using simulations (see figure below). Briefly, they set up 5 candidate network structures, and chose 1 structure as the `correct’ structure. They randomly parameterised a model of the correct structure, and obtained the responses to a press perturbation for randomly chosen species. These responses were treated as a past observation. They then used Monte Carlo simulations to find which of the candidate structures was assigned the highest likelihood, based on its ability to replicate the species response in the target structure’s model. This was repeated 100 times. Melbourne-Thomas et al. (2012) found that the method more often gave the correct candidate structure a higher likelihood than the other candidates, which suggests that the method does a good job of discerning the true model structure.
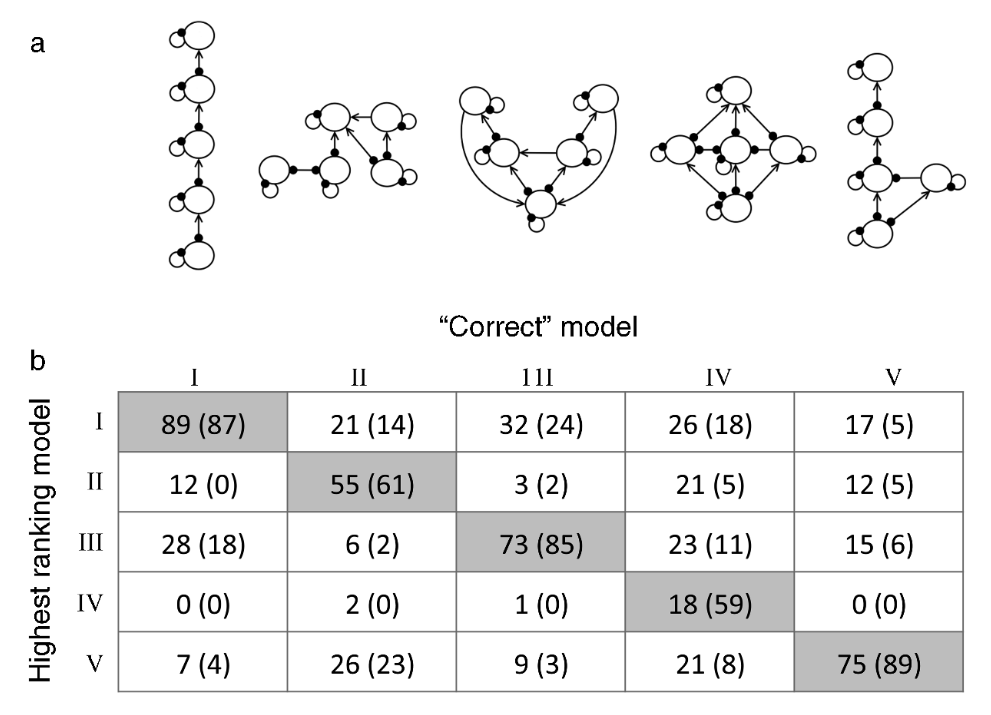
Figure 5 from the Melbourne-Thomas et al. (2012) paper; the candidate network structures (a), and the frequency with which each candidate structure was given the highest likelihood (rows) depending upon the correct structure (cols). Values given in parentheses are for the case where three (rather than two) species responses to a press perturbation were used as the past response. The point is that the method favours the correct candidate structure more than the other candidates (shaded cells).
It is interesting to note that the network structures Melbourne-Thomas et al. (2012) tested tested are all very different from one another. The candidate structures they chose are structures from real food webs, but from different systems. In contrast, the real-world application in their Appendix A2 has candidate structures that differ only by the presence/absence of a few interactions. Therefore I wondered if their method would perform as well if the candidate structures were more similar.
To test the ideas above, I repeated the simulation experiment from Melbourne-Thomas et al. (2012) on the candidate network structures shown in the figure below. These are variations on their structure IV, where I have arbitrarily removed some species interactions to create the different candidates. I have chosen this set-up for two reasons. First, I wanted the candidate structures to be very similar to each other, to reflect a real-world scenario. Second, I wanted to `isolate’ the effect of structural complexity on the method’s performance. Here, the number of interactions is a rough measure of the network’s structural complexity.
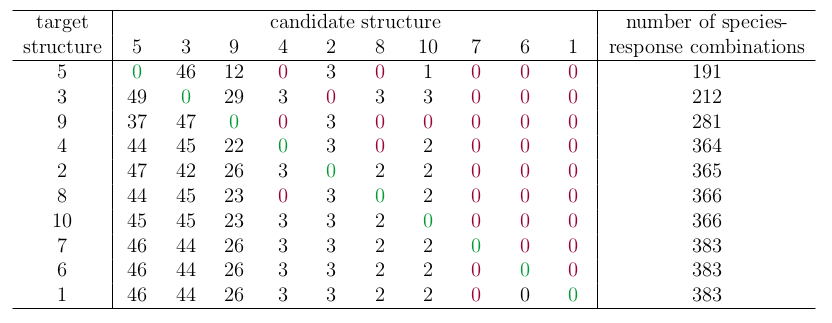
The results of the simulation are shown in the table below. I have ordered the rows by increasing number of interactions, which approximates the network’s structural complexity. I have highlighted simulations where the method more often gave the correct candidate structure the highest likelihood in green, and I have highlighted the opposite in red.
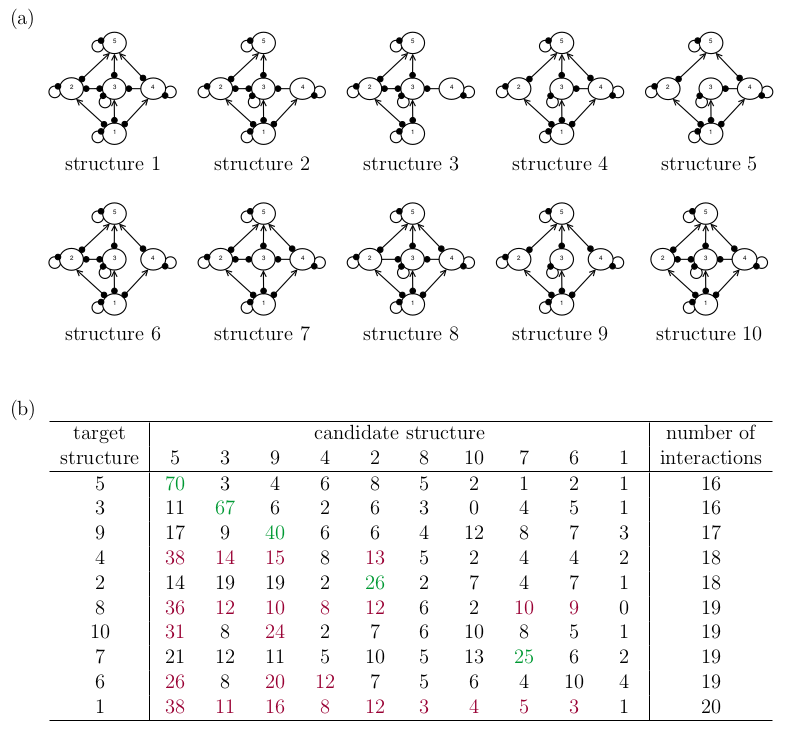
Ten candidate structures (a), and the frequency with which each candidate structure obtained highest or equal-highest likelihood in Monte Carlo simulations (b). The rows and columns in the table are ordered by the number of interactions in the network, which is a rough measure of structural complexity. The point is that the method does not always favour the correct structure, and favours structurally simpler candidates.
In contrast to the Melbourne-Thomas et al. (2012) result, the correct candidate is not always more favoured than the other candidates. Importantly, I found that the rankings below the diagonal in the table are generally higher than rankings above the diagonal, indicating that the method favours structurally simpler candidates.
A Boolean approach?
Lately, I’ve been interested in a Boolean approach to Qualitative Modelling. In short, the Boolean approach circumvents the problems of the Principle of Indifference by eschewing probabilistic interpretations. For the analysis, the full continuous-valued probability framework is replaced with a three-valued system, such that parameter values and predictions are classified as simply (1) possible, (2) necessary, or (3) impossible. More details can be found in other blog posts and an upcoming paper (Methods in Ecology and Evolution, to appear).
How would I apply the three-valued system to network structure? The simplest possible way would be to observe that, if a species response combination that was observed in the correct structure is impossible in a candidate structure, then that candidate structure is `impossible’.
The table below shows the percentage of times each candidate structure was excluded by the Boolean analysis, where the percentage is calculated relative to the species-response combinations possible given the structure. Again, favouring of the correct structure is highlighted in green, and the incorrect structure in red. Also reported is the total number of unique species responses observed in each structure.
Percentage of times the candidate web is excluded by the Boolean method due to its inability to reproduce an observed species-response combination in the target web, where the table rows and columns are ordered by the number of species-response combinations that the structure can produce. The point is that, although an incorrect candidate structure is never favoured over the correct structure, the method has difficulty ruling-out complex network structures.
In contrast to the results of Melbourne-Thomas et al. (2012), the Boolean method favours more complex network structures with a greater number of possible species-response combinations. Notably, the Boolean method never favours an incorrect candidate structure over the correct target structure. Unfortunately, the the Boolean method is often not able to exclude very many candidate structures, particularly when the candidate has high structural complexity (i.e. the columns of zeros on the right-hand side).
Final thoughts
From a conservation management perspective, the tendency of the Melbourne-Thomas et al. (2012) approach to favour simpler structures may not be desirable for two reasons: (1) because selecting for simpler network structures leads to less conservative predictions, and (2) because the theoretical grounds for preferring simpler structures is unclear.
First, because the likelihood measure favours structures that produce fewer species-response combinations, it is favouring model structures that will predict fewer possible outcomes to some proposed management intervention. Further, when simpler structures are called upon to make predictions in a probabilistic QM framework, the evidential support for the predictions they do make will be high. For example, the simple chain structure can only predict one species-response prediction - and it makes that prediction 100% of the time. However, another way of interpreting this high probability is to observe that it is merely a result of the structure being too simple to predict other alternatives. If the purpose of employing QM to support decision-making is a cautious one - to warn us about what might possibly go wrong when we interfere with ecosystems - then to favour structures that produce fewer possible outcomes seems to work against that conservative objective.
Second, there is no theoretical reason to presuppose that real ecological systems have a tendency to structure themselves to be simple. In this case, favouring simpler structures amounts to minimising the number of possible species-response predictions that the structure can produce, where those species-response combinations go unrealised in the real system. I can’t think of any reason why ecosystems should organise themselves in this way.
Nevertheless, one might argue that favouring structurally simpler interaction networks is preferable in accordance with the Principle of Parsimony. This is a philosophically complicated concept, and how to apply this concept to network structural uncertainty is a bit beyond me. The best I can think of is perhaps the most famous example of parsimony in model selection: AIC. There, model choice involves a trade-off between likelihood and model complexity (measured by number of parameters). However, in AIC, the complexity penalty isn’t applied externally, but emerges as a consequence of the fact that high-complexity models will be overfitted and therefore do a poor job of predicting future data.
In my case, the simpler structures - i.e. the more parsimonious ones - seem to be the ones who are overfitted. Indeed, my thought experiment was specifically contrived to be an exercise in overfitting. I chose the structure I did because it cannot produce any response apart from the past response, and as a consequence, it will almost certainly do a poor job of predicting future responses. In my simulation experiment, incorrect simpler structures were favoured over the correct complex structures (i.e. structures 1, 6, 8, 10) because simpler structures produce a narrower range of predictions altogether, including the predictions concerning the species involved in the past response. The analogy to AIC is not perfect, but it seems to me that, if we were to apply something like AIC to structural uncertainty, then the penalty should be applied for structural simplicity rather than complexity.
References
Abrams, P. A. (2001). Describing and quantifying interspecific interactions: a commentary on recent approaches, Oikos 94(2): 209–218.
Justus, J. (2006). Loop analysis and qualitative modeling: limitations and merits, Biology and Philosophy 21(5): 647–666.
Melbourne-Thomas, J., Wotherspoon, S., Raymond, B. and Constable, A. (2012). Comprehensive evaluation of model uncertainty in qualitative network analyses, Ecological Monographs 82(4): 505–519.
Nakajima, H. (1992). Sensitivity and stability of flow networks, Ecological Modelling 62(1): 123–133.
Raymond, B., McInnes, J., Dambacher, J. M., Way, S. and Bergstrom, D. M. (2011).
Qualitative modelling of invasive species eradication on subantarctic Macquarie Island, Journal of Applied Ecology 48(1): 181–191.
Yodzis, P. (1988). The indeterminacy of ecological interactions as perceived through perturbation experiments, Ecology 69(2): 508–515.