Pretty food web graphs
When analysing output from the Webworld food web assembly algorithm (Drossel et al. 2001, J. Theor. Biol.), I often need a good way to quickly summarise the key properties of a web. In a recent project, I created a version of Webworld in which species could invade from outside the web (randomly generated species traits, as opposed to traits derived through mutation of a native species). I wanted to know what some of my food webs looked like, including information about their lineages, so started creating figures like the one below.
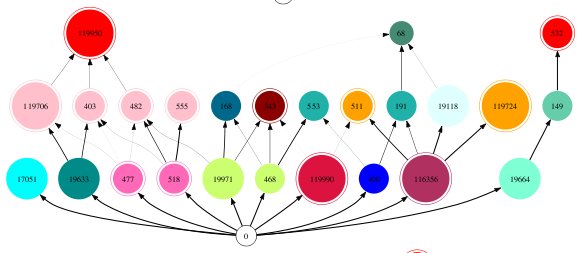
Webworld food web diagram generated with dotty
Species are identified by a number, which corresponds to the order at which they entered the web, either via mutation or invasion. The colours indicated the lineages, with species of the same colour coming from the same lineage. Species with a double circle are invaders or have an invader as an ancestor, and others are descended from the original native species.
I use graphviz to create my food web diagrams. To create the pictures, one must first create a .dot file like web0.dot, and then the postscript image can be created by running dot -Tps web0.dot > web0.ps.
You can download the web0.dot directly from my website to see how the elements of the figure are made. However the key parts are as follows:
0 -> 14549 [style="setlinewidth(1.82)"];: Draws a path from species 0 to species 14549. I’ve set the linewidth proportional to the proportion that the food source contributes to the predator’s overall nutrient intake.14549 [color=blue,style=filled];: This colours species’ 14549 node in blue.119950 [color=red,style=filled,shape=doublecircle];: An example of a species’ node with a double circle
The creation of a .dot file can be automated, depending upon what kind of information one stores about during the food web assembly. For inspiration, my older Octave code contained lines like:
%g [style="setlinewidth(%g)"]; n',idVec(fromVec(entInd)),idVec(toVec(entInd)),edgVec(entInd));