Example debugging mixed Python C++ in VS Code
Visual Studio Code has the ability to debug mixed Python with C++ extensions. In this blog post, I give an example of how to get it working.
I’m going to do the example from scratch in five steps:
- Make virtual environment. Chances are that, if you’re doing this kind of thing, you’ll be wanting to use a virtual environment too.
- Write code. My toy example is a C++ extension that just adds two numbers together.
- Set up VS Code project. Important to point the interpreter to virtual environment.
- Create
launch.json. Configure the debugger so it can both run on python launch and attach to C++. - Run two debuggers at once. How to pause the debugger and switch from python to C++ (with screenshots).
Step 1. Make virtual environment
$ virtualenv --python=python3.6 myadd
Running virtualenv with interpreter /usr/bin/python3.6 ...

$ cd myadd/

$ ls
bin  include  lib  share
Activating the environment changes the prompt as a reminder
$ . bin/activate
(myadd) $
I’ll be working from within the virtual environment from here on.
Step 2. Write example code
Write the C++ extension.
(myadd) $ vim myadd.cppInside myadd.cpp:
#include <Python.h>

static PyObject *method_myadd(PyObject *self, PyObject *args){
    int x, y, z = -1;

    /* Parse arguments */
    if(!PyArg_ParseTuple(args, "ii", &x, &y)){
            return NULL;
    }

    /* The actual bit of code I need */
    z = x + y;

    return PyLong_FromLong(z);
}

static PyMethodDef myaddMethods[] = {
    {"myadd", method_myadd, METH_VARARGS, "Python interface for myadd C library function"},
    {NULL, NULL, 0, NULL}
};

static struct PyModuleDef myaddmodule = {
    PyModuleDef_HEAD_INIT,
    "myadd",
    "Python interface for the myadd C library function",
    -1,
    myaddMethods
};

PyMODINIT_FUNC PyInit_myadd(void) {
    return PyModule_Create(&myaddmodule);
}
Write the python we’d want to use that calls the C++
(myadd) $ vim myscript.pyInside myscript.py, I write very simple code that imports myadd and uses it to add 5 and 6 together.
import myadd

print("going to ADD SOME NUMBERS")

x = myadd.myadd(5,6)

print(x)
Write the setup script.
(myadd) $ vim setup.pyInside setup.py:
from distutils.core import setup, Extension

def main():
    setup(name="myadd",
          version="1.0.0",
          description="Python interface for the myadd C library function",
          author="Nadiah",
          author_email="nadiah@nadiah.org",
          ext_modules=[Extension("myadd", ["myadd.cpp"])],
          )


if __name__ == "__main__":
    main()
Run the setup script.
(myadd) $ python3 setup.py install
running install
running build
running build_ext...
Now myadd is available as a module in this virtual environment.
We can check that it works by running the script.
(myadd) $ python myscript.py
going to ADD SOME NUMBERS
11
Step 3: Basic setup of VS Code project
Fire up VS Code while in the virtual environment
(myadd) $ code .The first step is to choose the virtual environment’s Python interpreter as our default Python interpreter. Hit ctrl + shift + p, and choose ./bin/python (or wherever you put your virtual environment).
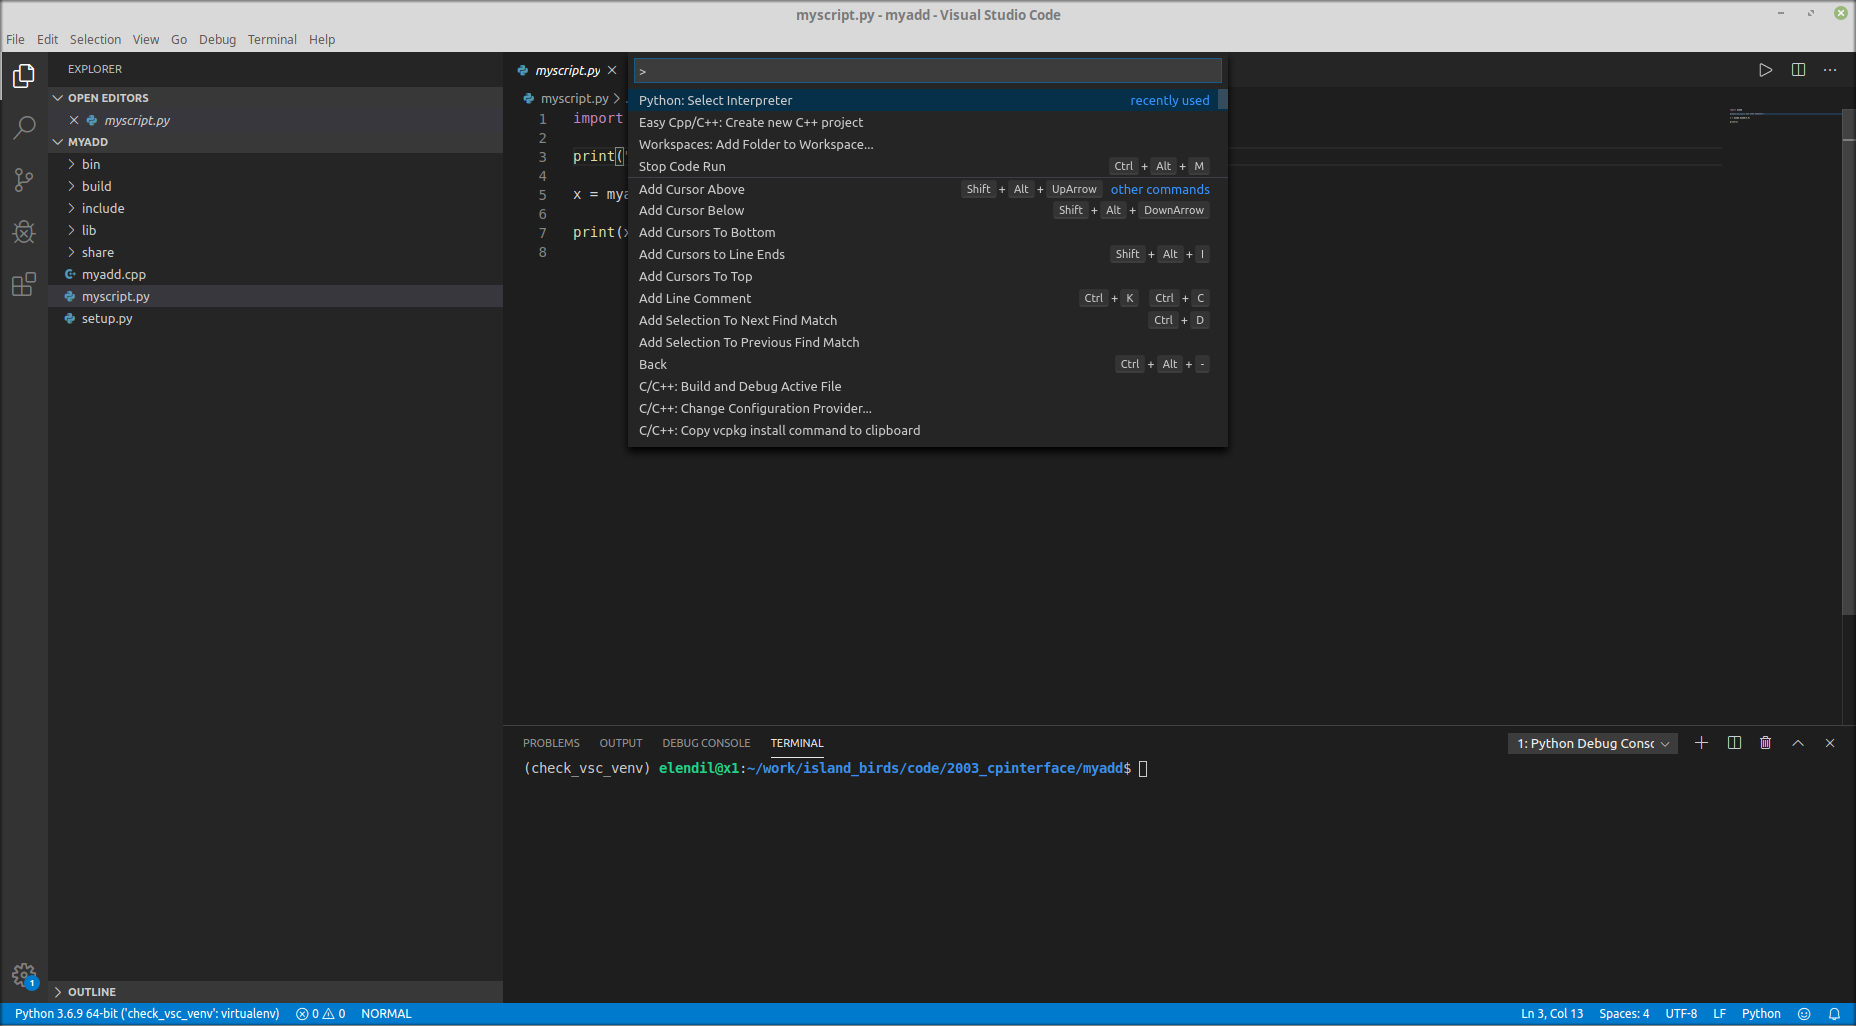
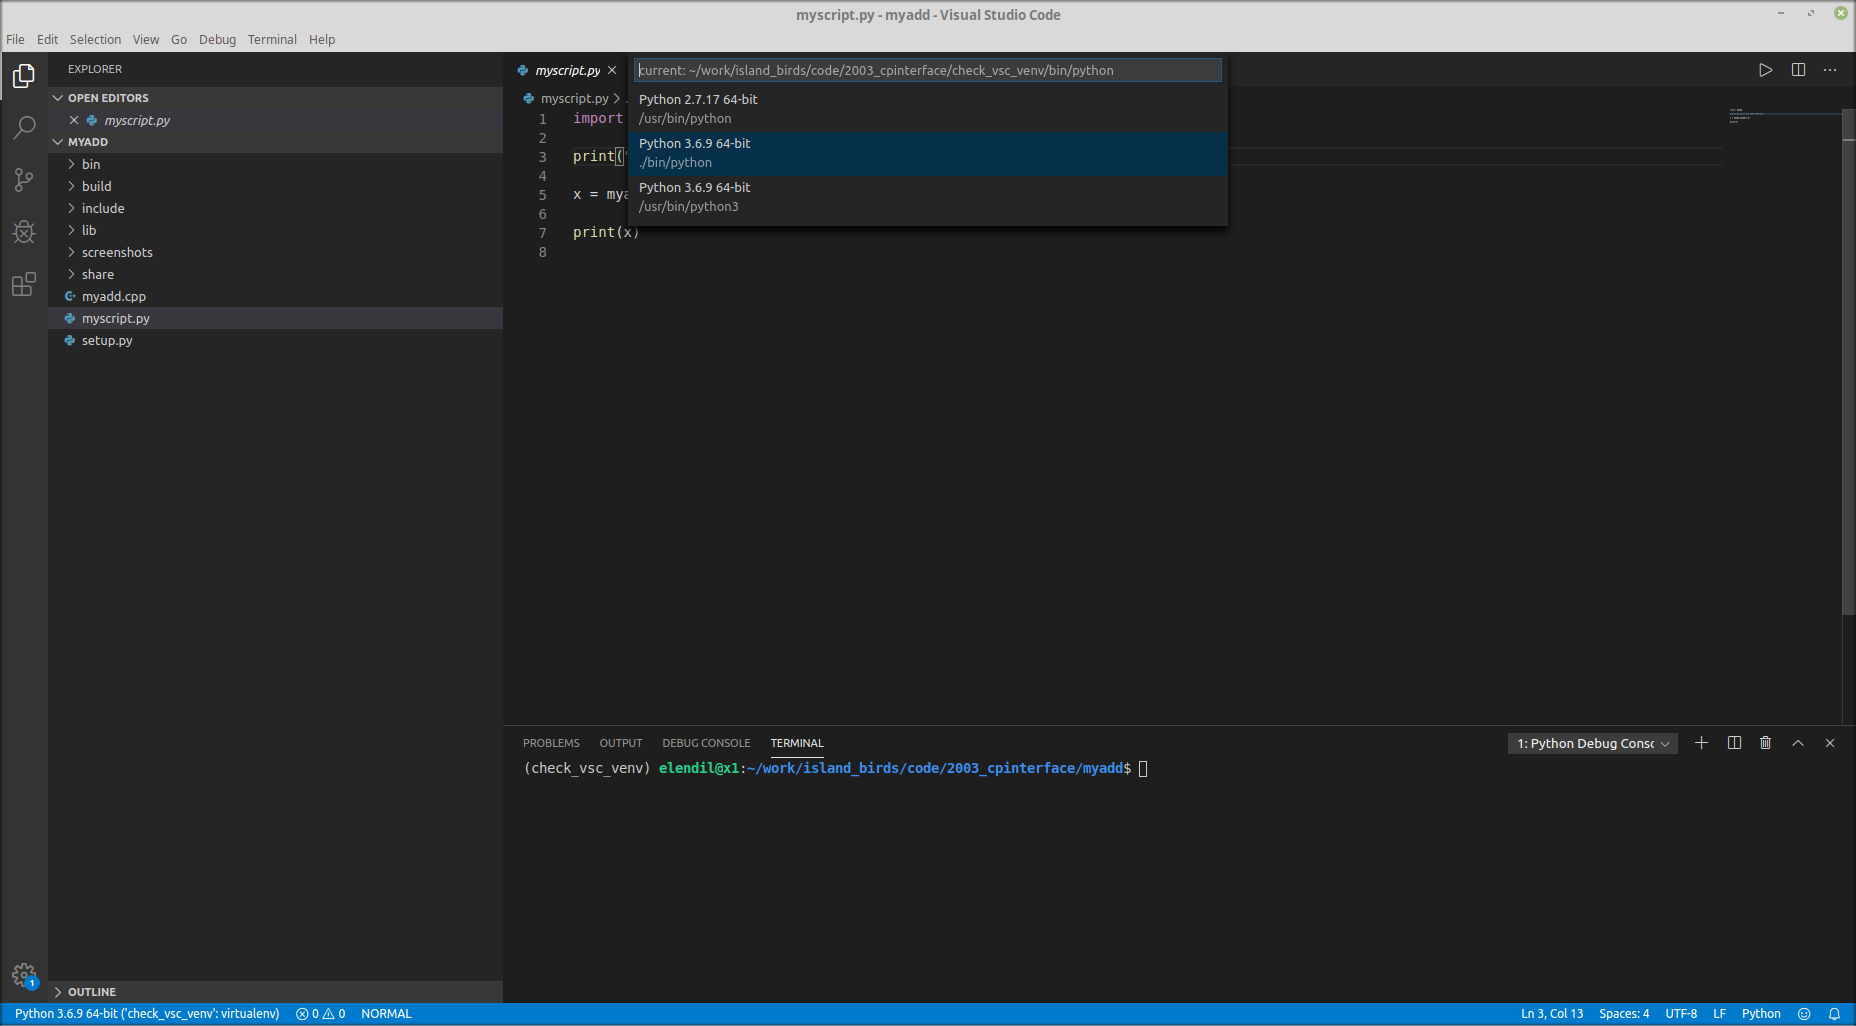
Click images to make them bigger
This will create the settings.json, which will look something like this:
{
    "python.pythonPath": "bin/python"
}
Step 4: Create launch.json
The launch.json file is used to configure the debugger in VS Code. In this file, we need to tell VS Code that there are two ways we want to run the debugger: (1) for the Python script, on launching the file; and (2) for the C++ portion, we want to attach that to a Python debugger process that’s already going.
The following code goes in .vscode/launch.json, or you can create it from within the VS Code gui by clicking on the debugger icon (the little bug) and clicking on the blue link that says “create a launch.json file”.
{
    "version": "0.2.0",
    "configurations": [
        {
            "name": "Python: Current File",
            "type": "python",
            "request": "launch",
            "program": "${file}",
            "console": "integratedTerminal"
        },
        {
            "name": "(gdb) Attach",
            "type": "cppdbg",
            "request": "attach",
            "program": "${workspaceRoot}/bin/python", /* My virtual env */
            "processId": "${command:pickProcess}",
            "MIMode": "gdb",
            "setupCommands": [
                {
                    "description": "Enable pretty-printing for gdb",
                    "text": "-enable-pretty-printing",
                    "ignoreFailures": true
                }
            ]
        }
    ]
}
Step 5: Run two debuggers at once
Add a debug breakpoint in the Python script before it drops into myadd(), and add another one in myadd.cpp at the line z = x+y.
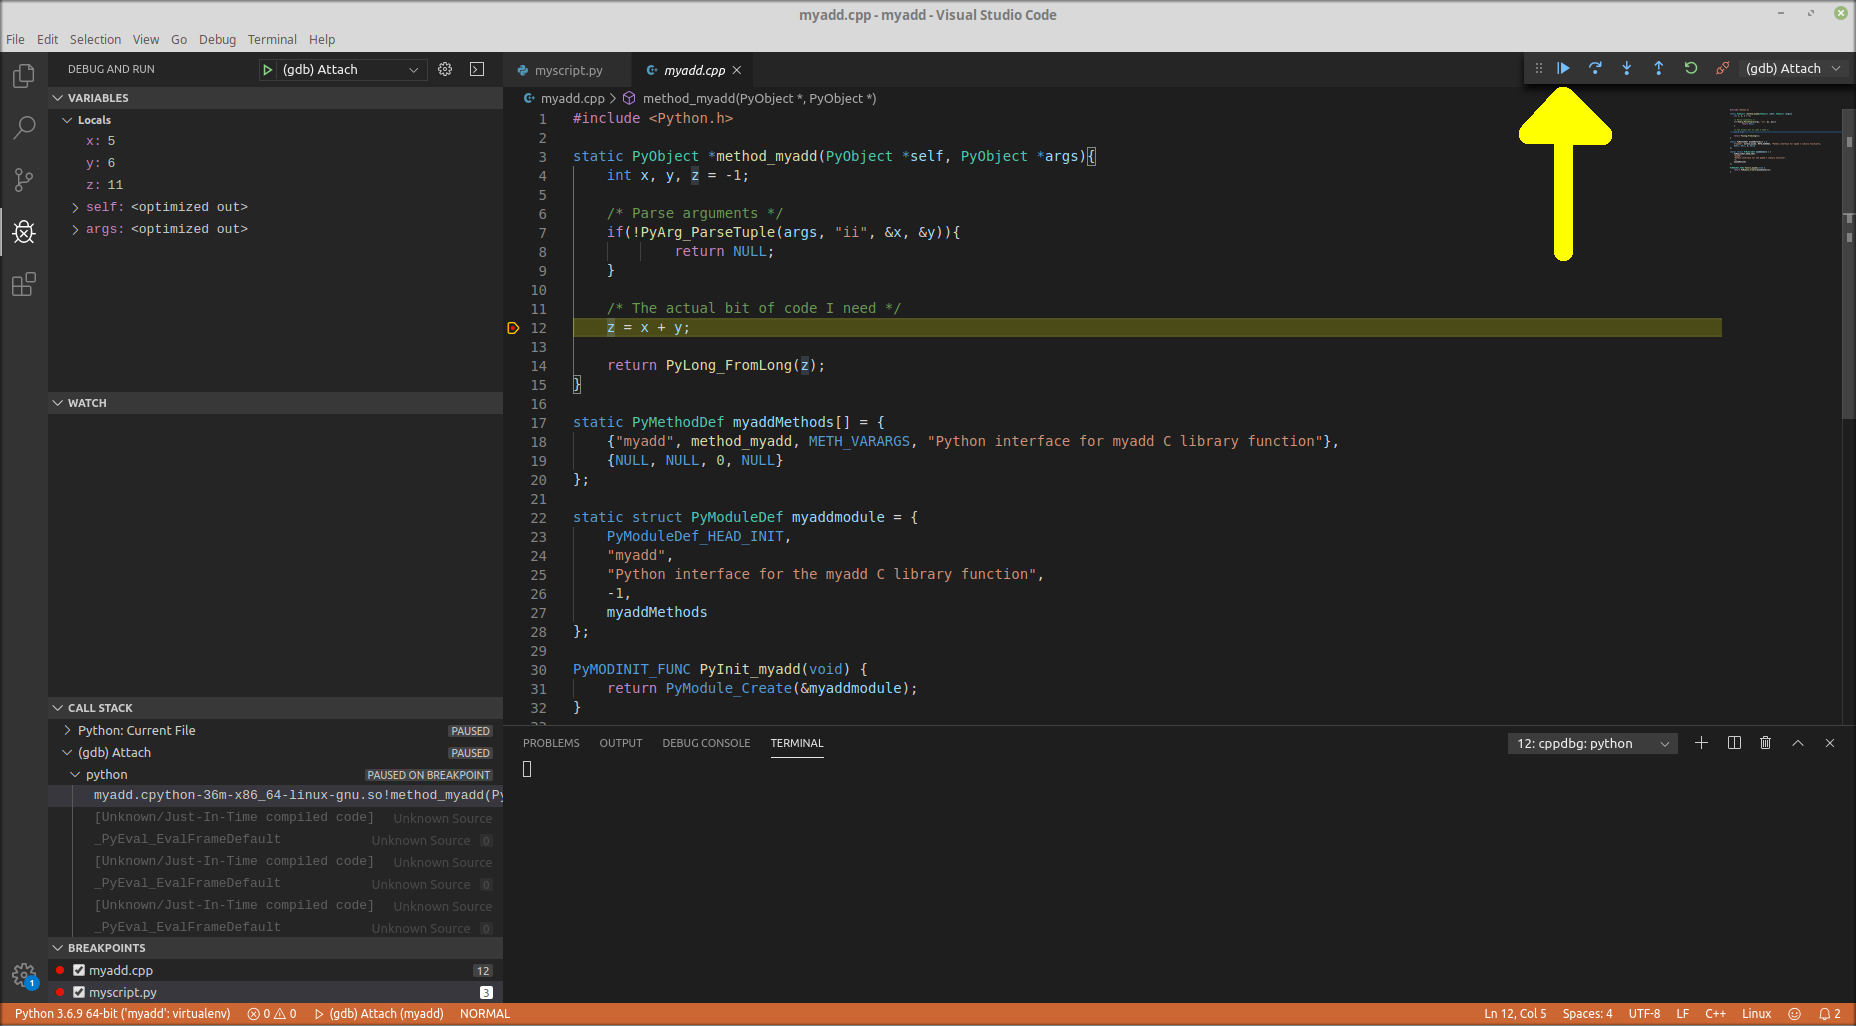
First, we’ll start the Python debugger. While focused on myscript.py, click the debugger icon, then click on the little green right-arrow icon next to “Python: Current file”.
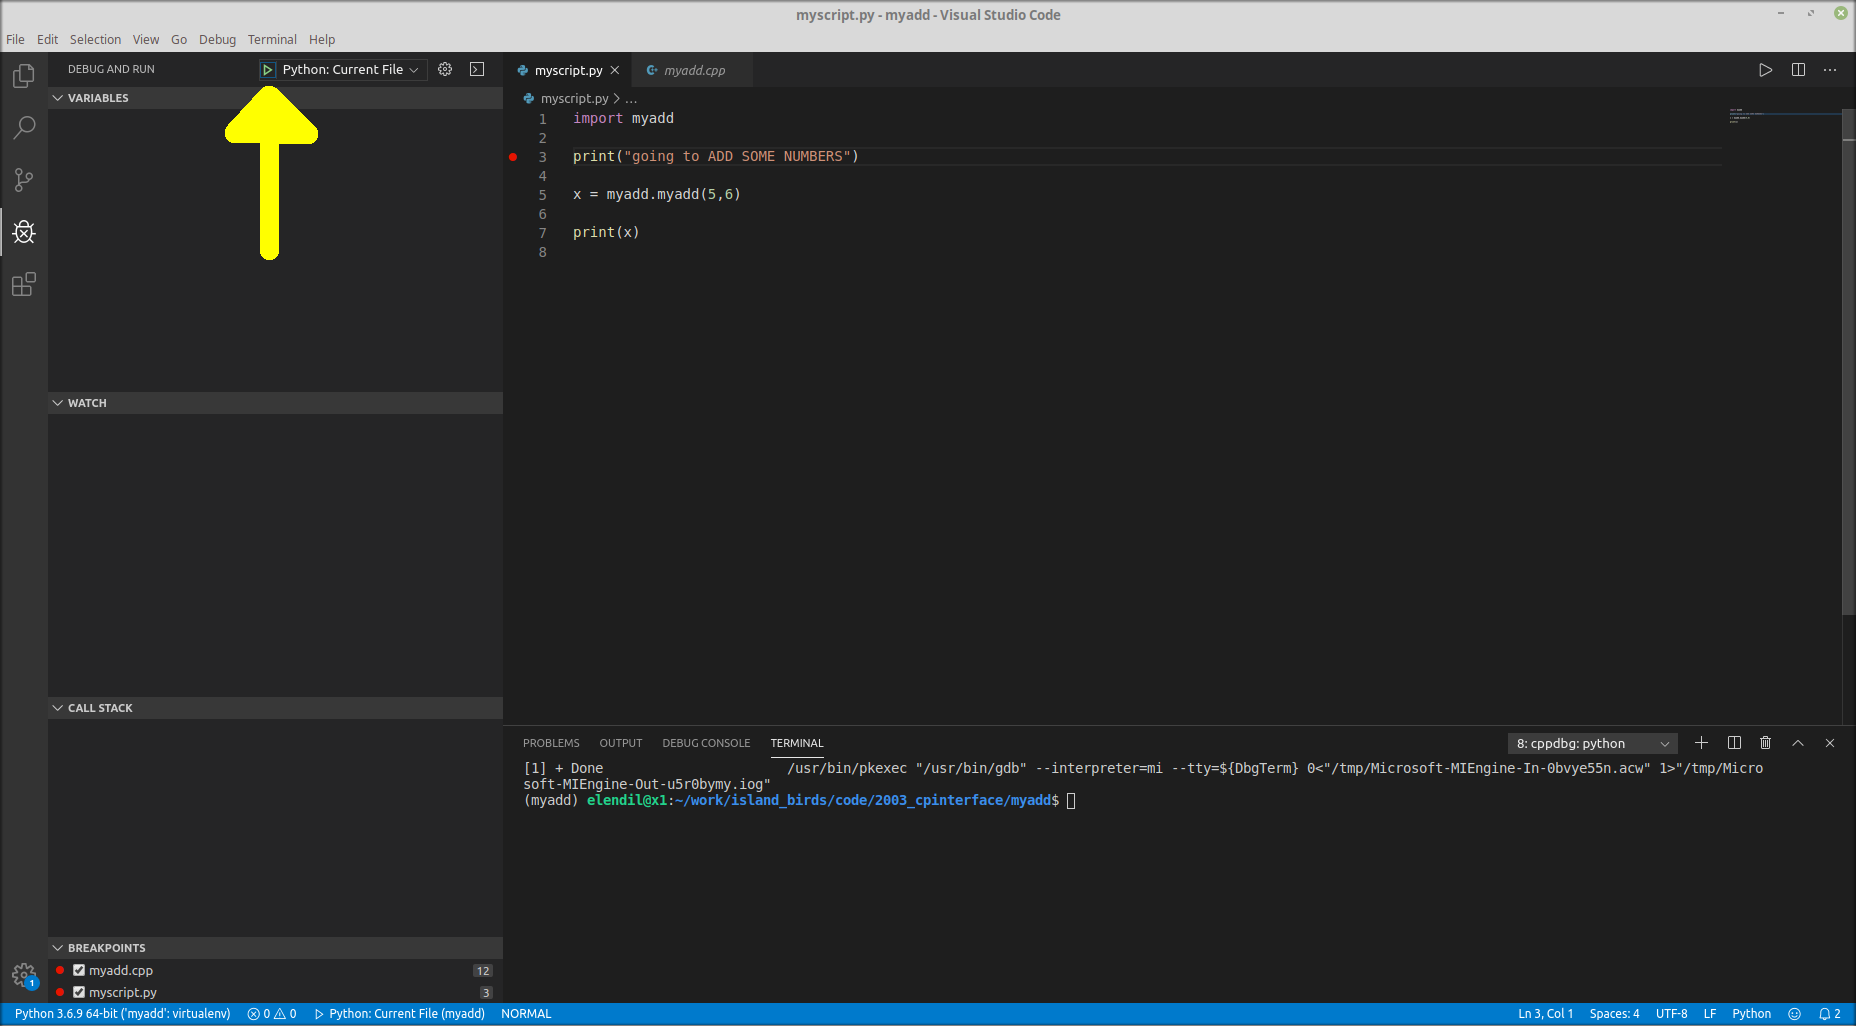
The debugger will work through myscript.py and stop at the first breakpoint.
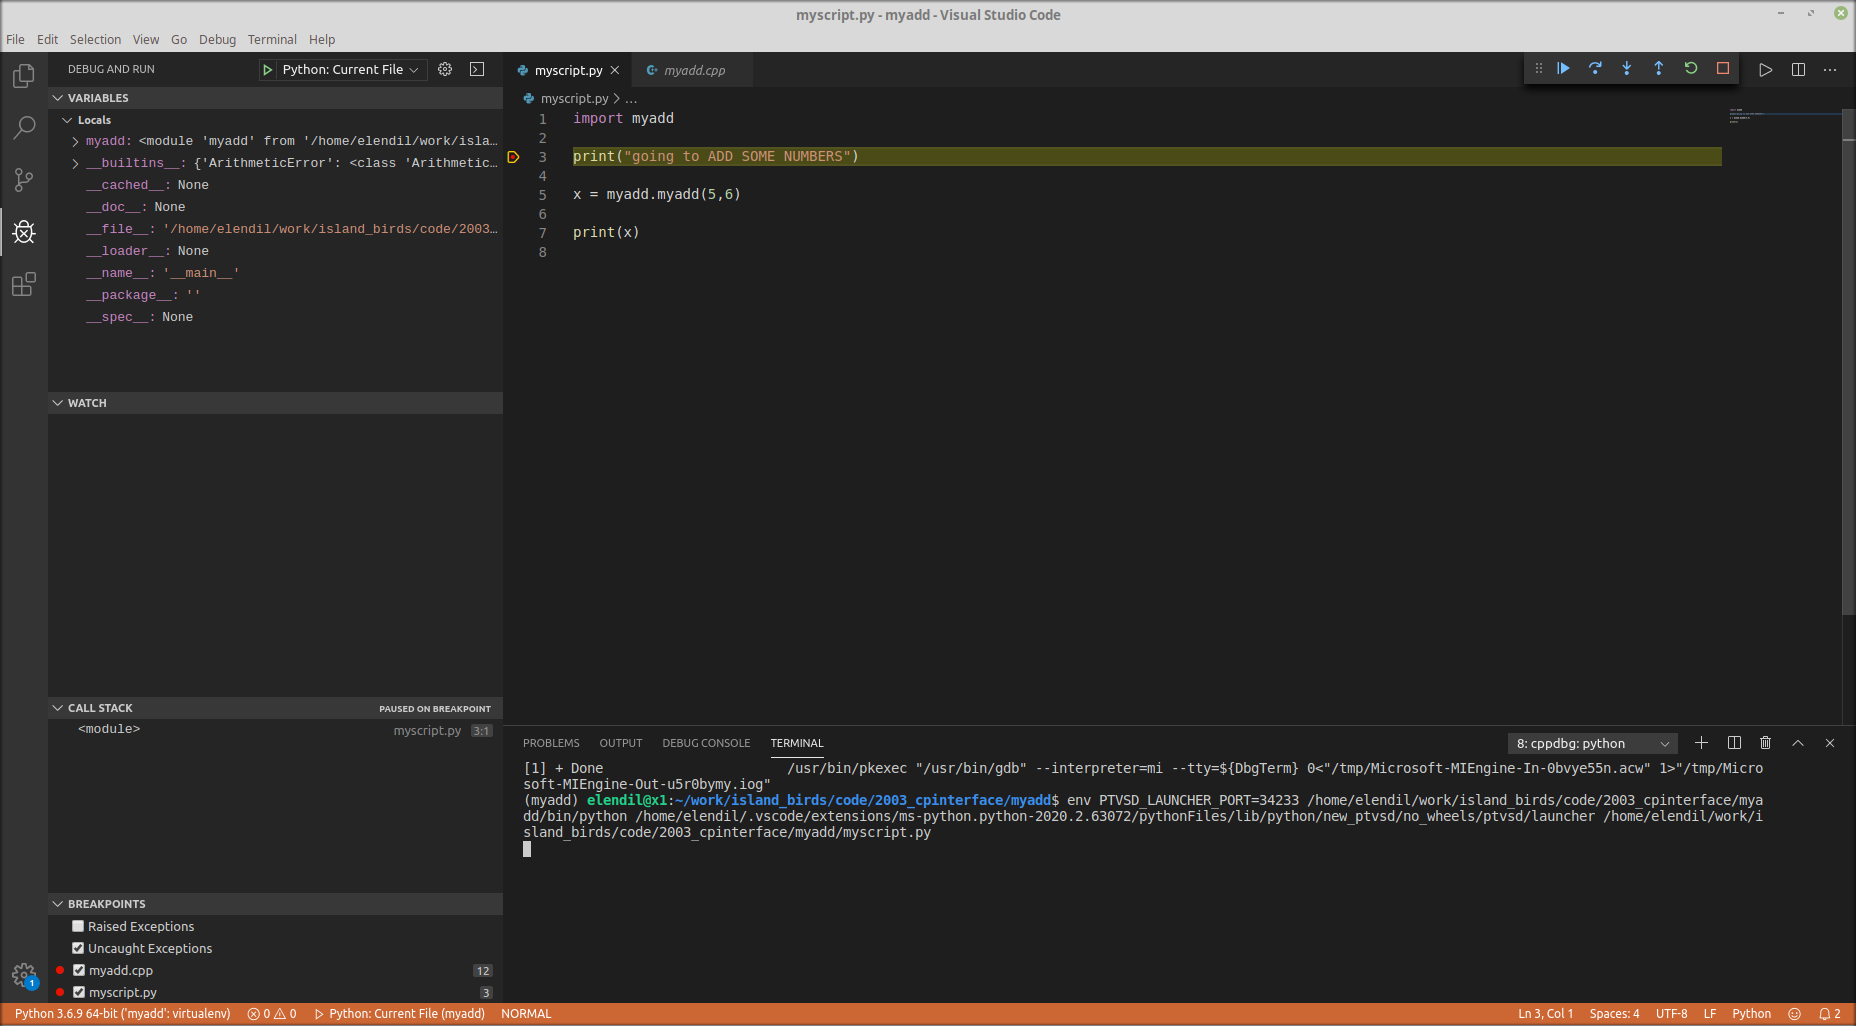
While the debugger is paused, we will need to start the second debugger and attach it to the Python debugger process.
First we identify the Python process. Open a new terminal, run ps aux | grep python, and look for the process that has the token. In my case, it’s process number 4482.
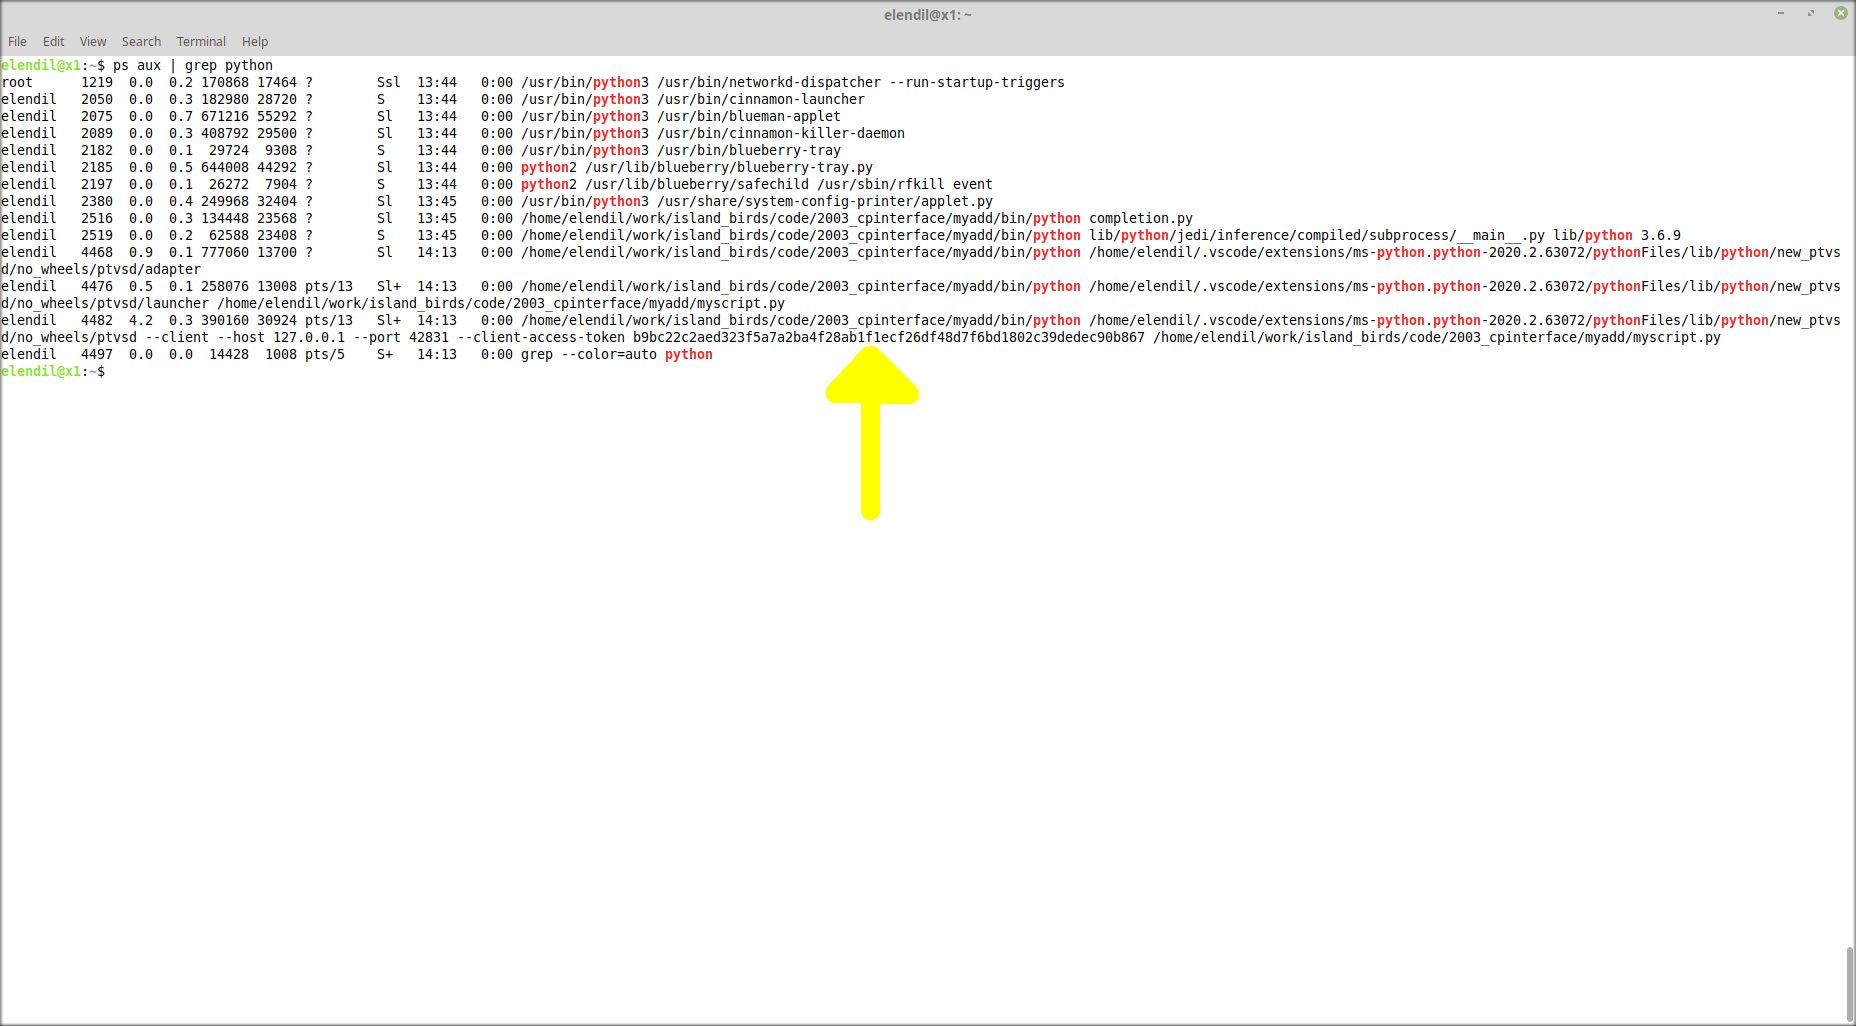
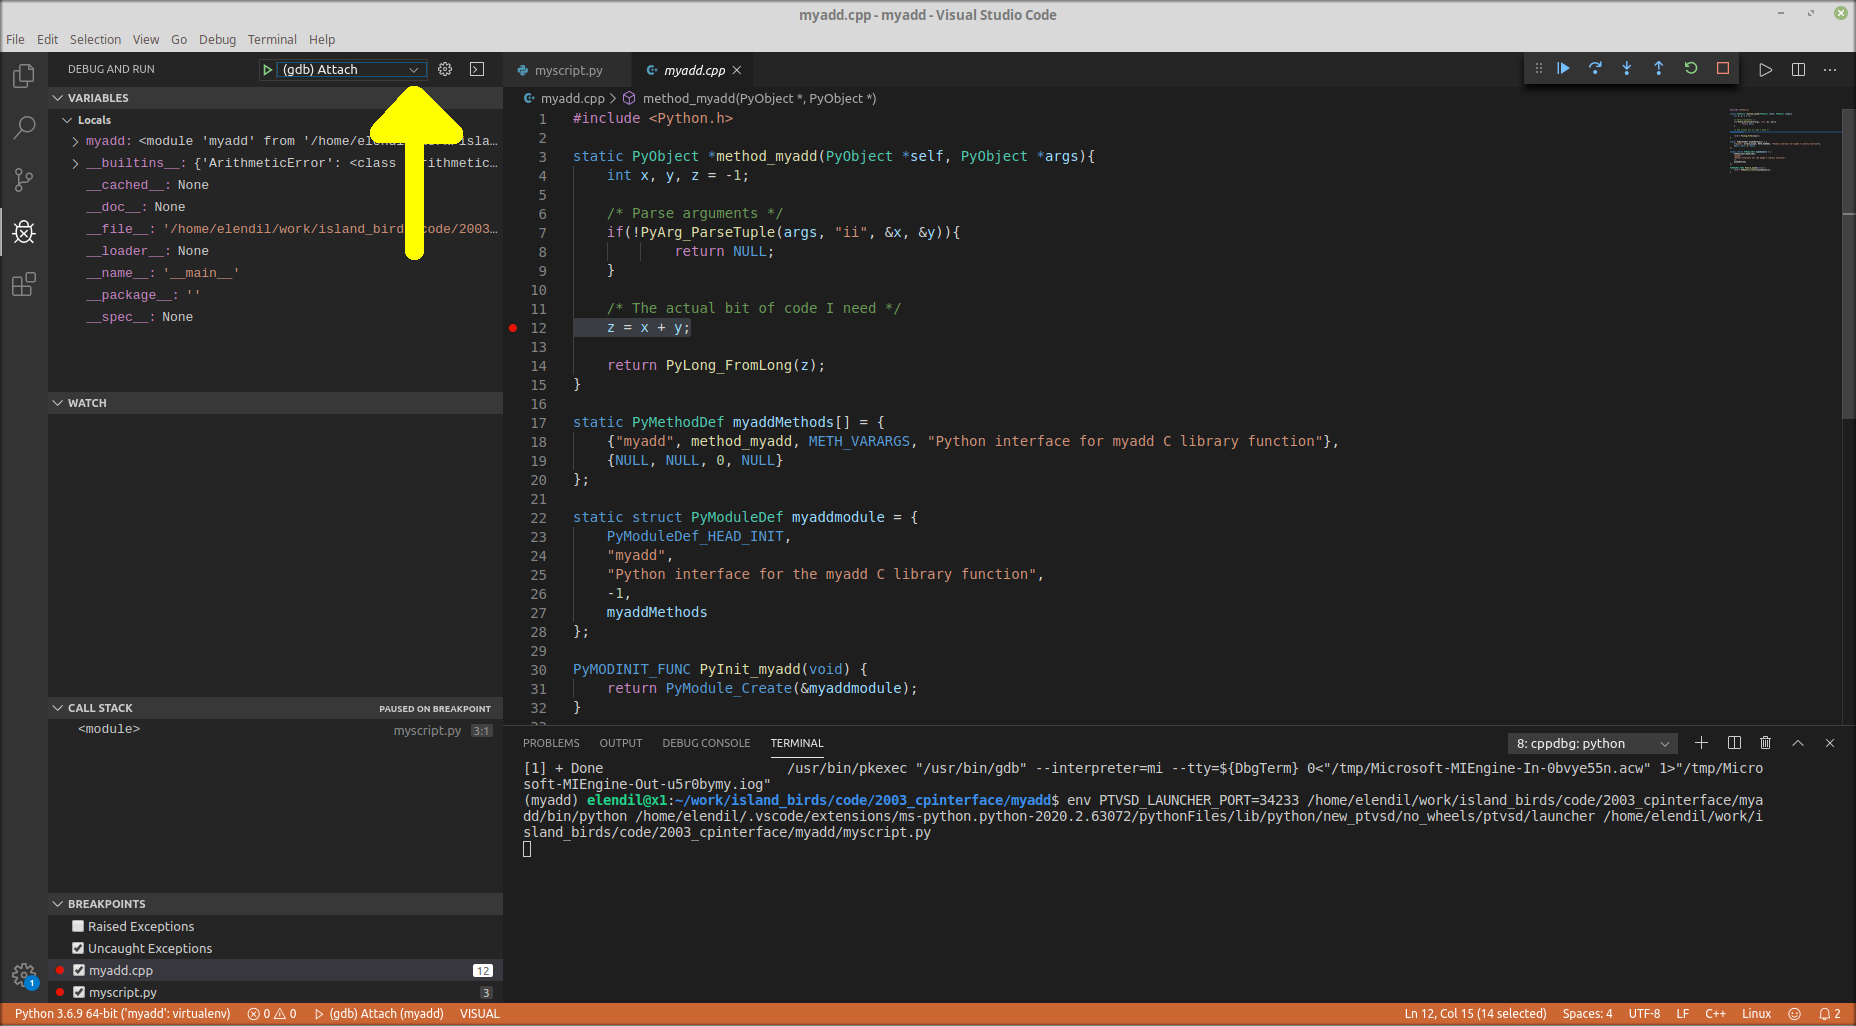
Go back to VS Code, and focus on the file myadd.cpp. Now use the drop-down to choose “(gdb) Attach”, then click the green play button.
The debugger will then ask you to choose which process to attach the debugger to. Type in the process number from before, and it will find the Python process.
[note: a Stackoverflow question about issues at this step]
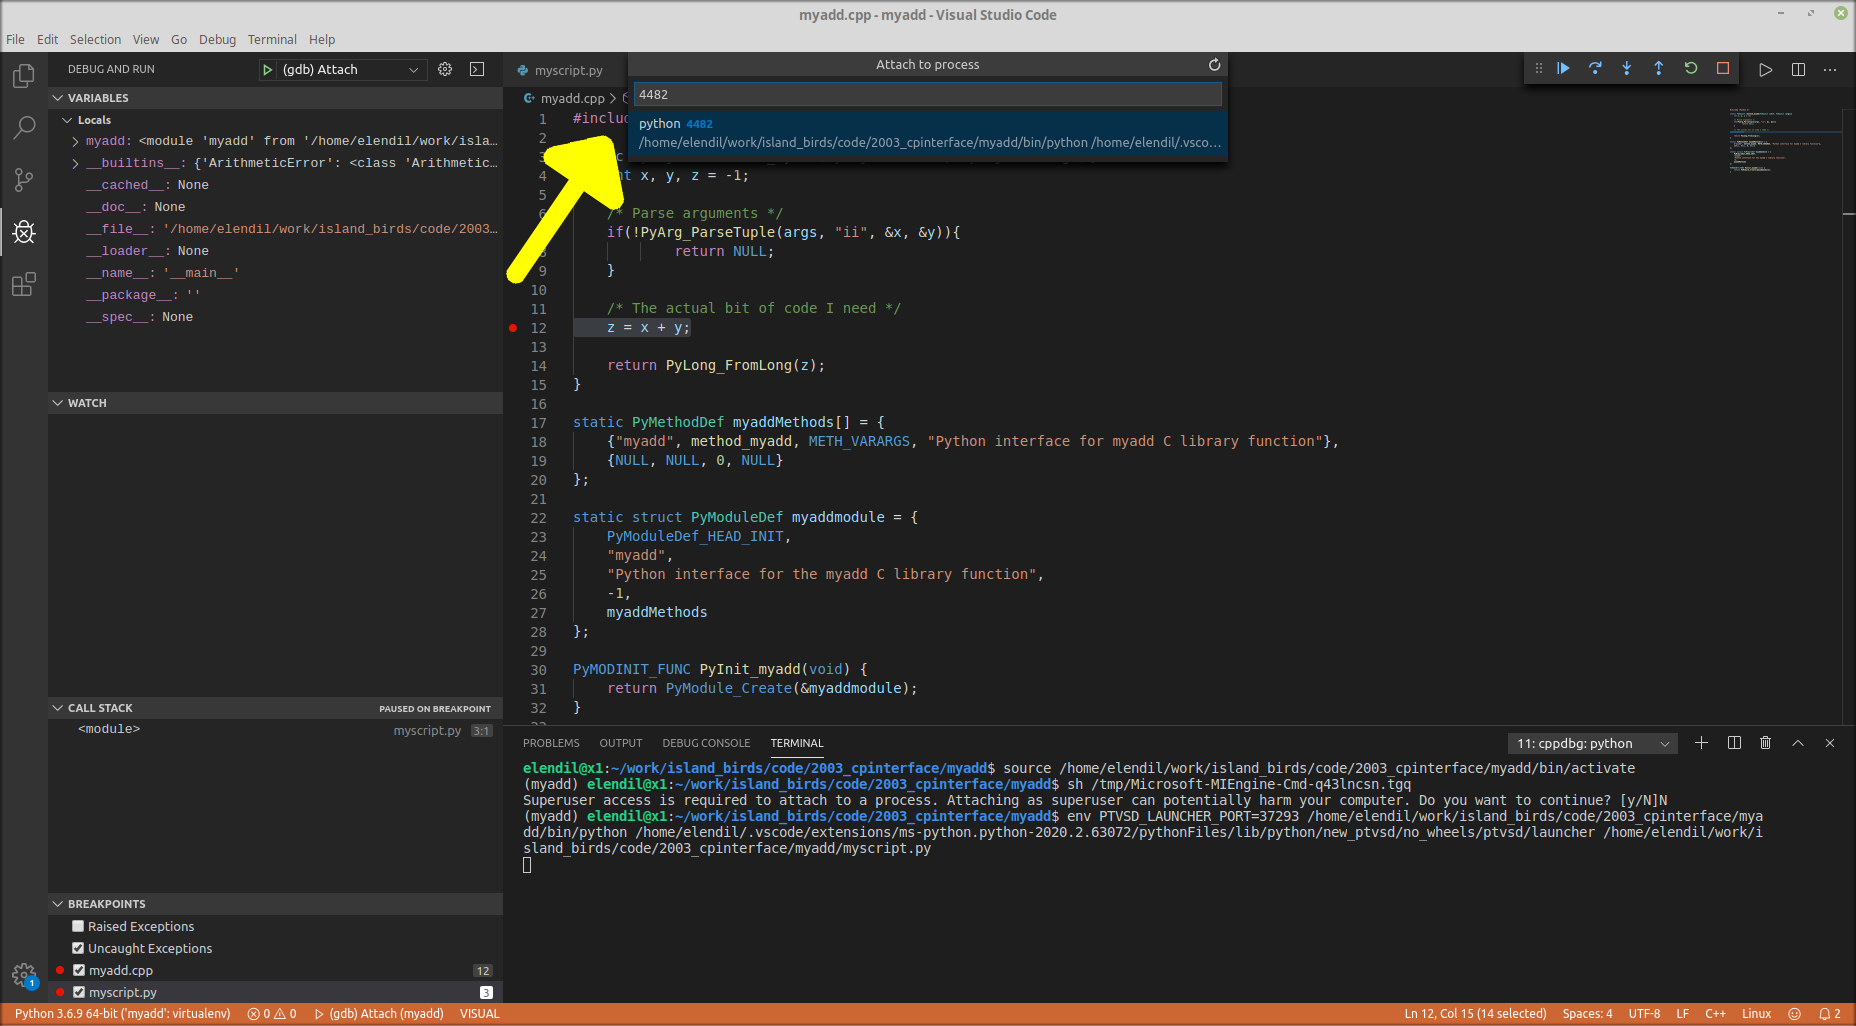
In the terminal, VS Code will tell you that superuser access is required to attach to a process. Type in Y and enter the root password.
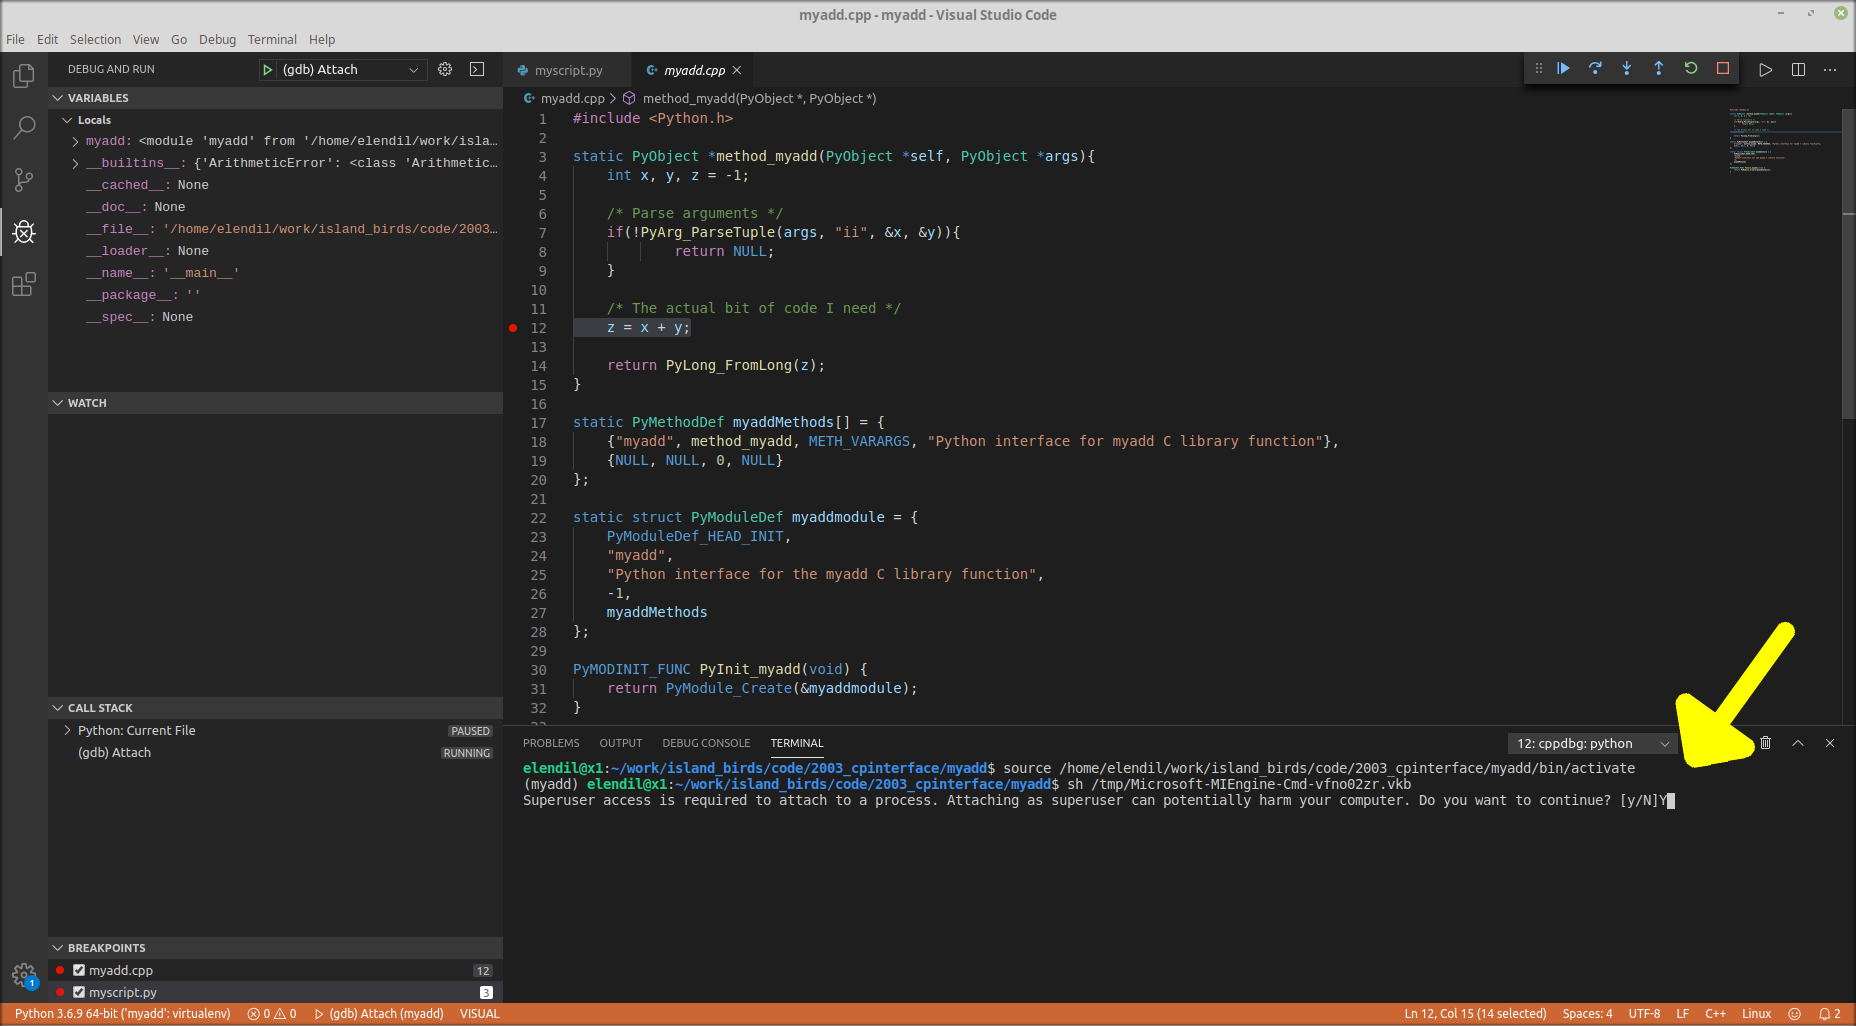
Now when you click continue in the debugging process (blue play button), the debugger will drop into the cpp file and you will be able to do the usual debugging things.
