Filed Under #undiscovered_extinctions
Dec 15, 2023
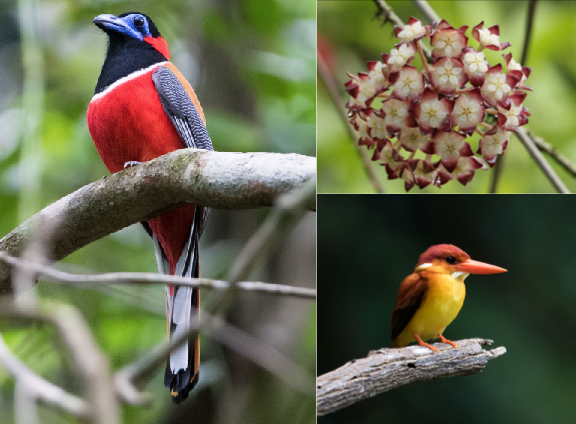 What are the impacts of tropical deforestation on biodiversity? To assess this, case studies are needed of tropical regions that have both a history of substantial deforestation and reliable biodiversity data. Singapore was almost entirely forested two hundred years ago but today less than 1% of the original primary forest remains today, with an additional ~20% of the landscape covered in lower quality secondary forest. Singapore also has an exceptionally detailed biodiversity record. Many species have gone extinct from Singapore, from the majestic tiger, the last of which was shot in the 1930s, to the humble epiphyte Hoya finlaysonii, which...
Our new PNAS paper on historical extinctions in Singapore is out
What are the impacts of tropical deforestation on biodiversity? To assess this, case studies are needed of tropical regions that have both a history of substantial deforestation and reliable biodiversity data. Singapore was almost entirely forested two hundred years ago but today less than 1% of the original primary forest remains today, with an additional ~20% of the landscape covered in lower quality secondary forest. Singapore also has an exceptionally detailed biodiversity record. Many species have gone extinct from Singapore, from the majestic tiger, the last of which was shot in the 1930s, to the humble epiphyte Hoya finlaysonii, which...
Jun 24, 2020
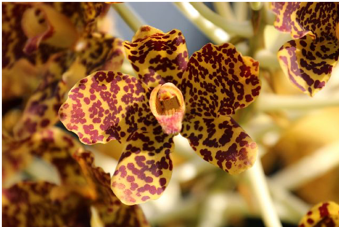 Have you ever wondered how many species were lost before we had the chance to discover them? In a paper now out in Conservation Biology, we estimated just that, for plant species in Singapore. This paper follows from the Chisholm Lab’s related work on Singapore birds and butterflies. The orchid species Grammatophyllum speciosum has not been recorded in Singapore since 1918. Photo credit: Cerlin Ng All over the world, many species remain undiscovered while both known and unknown species continue to go extinct. This is particularly true in the tropics, where biodiversity is high and development continues apace. Singapore provides...
Estimating undiscovered extinctions
Have you ever wondered how many species were lost before we had the chance to discover them? In a paper now out in Conservation Biology, we estimated just that, for plant species in Singapore. This paper follows from the Chisholm Lab’s related work on Singapore birds and butterflies. The orchid species Grammatophyllum speciosum has not been recorded in Singapore since 1918. Photo credit: Cerlin Ng All over the world, many species remain undiscovered while both known and unknown species continue to go extinct. This is particularly true in the tropics, where biodiversity is high and development continues apace. Singapore provides...
Jan 16, 2020
 Meryl Theng just had a new paper published in Biological Conservation, where she estimated that 46% of Singapore’s butterfly species have been extirpated since 1854. The special thing about this estimate is that it includes all species that existed, including species that went extinct before we had a chance to discover them. The trick to estimating undiscovered extinctions is the SEUX model. There is a nice write-up about the paper on Ryan’s blog. The paper has also received a good response in the press - The Straits Times and The Star have covered it - and it is generating some...
Extinction of undiscovered butterflies + tutorial
Meryl Theng just had a new paper published in Biological Conservation, where she estimated that 46% of Singapore’s butterfly species have been extirpated since 1854. The special thing about this estimate is that it includes all species that existed, including species that went extinct before we had a chance to discover them. The trick to estimating undiscovered extinctions is the SEUX model. There is a nice write-up about the paper on Ryan’s blog. The paper has also received a good response in the press - The Straits Times and The Star have covered it - and it is generating some...
Dec 24, 2018
Relationship between species discovery and extinction probability
[Update: thoughts in this post contributed to Kristensen et al. (2020).] What is the relationship between a plant’s historical probability of having being discovered and its probability that it went extinct? All else being equal, species with low abundance are less likely to be collected, and low abundance is both theoretically (e.g. McCarthy et al., 2014) and empirically cited as a good predictor of extinction probability. The empirical relationship has been observed both in general (McKinney, 1997) and specifically for plants (Sutton and Morgan, 2009; Matthies et al., 2004). It has also been found in the context of habitat fragmentation...Sep 14, 2017
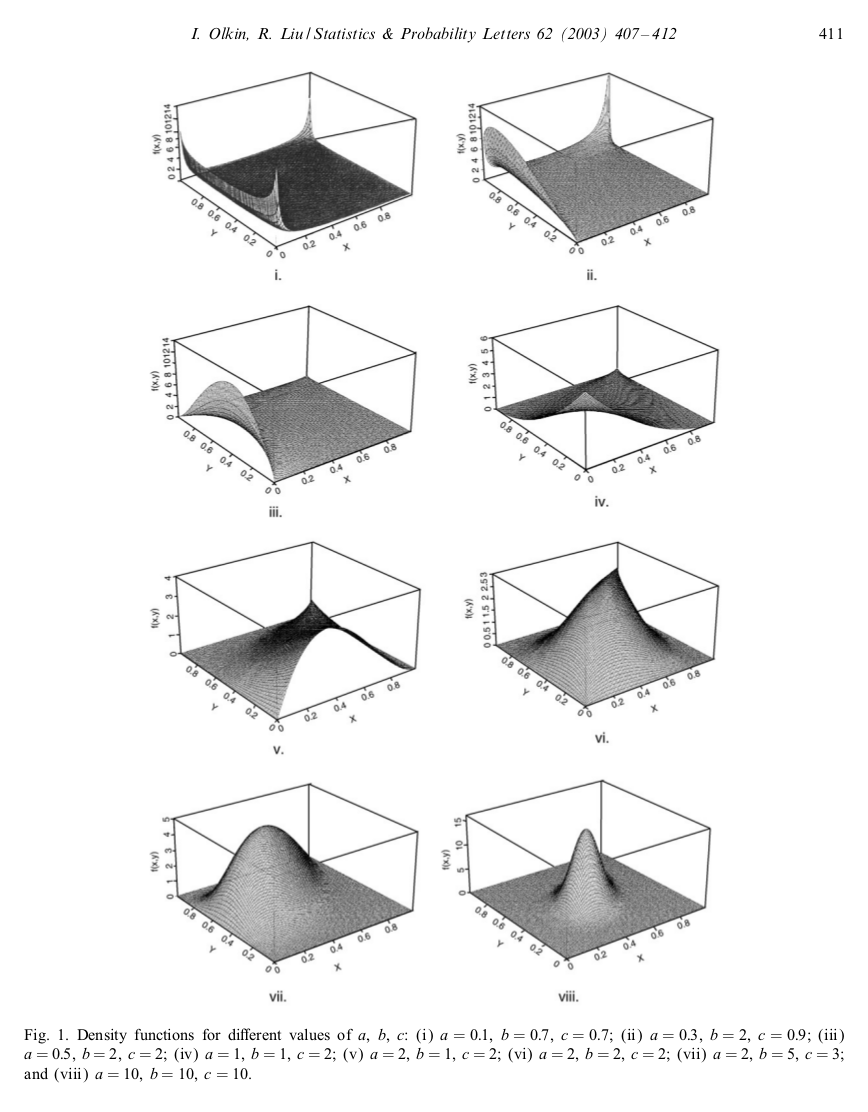 A common choice for a probability distribution of a probability is the beta distribution. It has the required support between 0 and 1, and with its two parameters we can obtain a pretty wide qualitative range for the probability density function. What should we do if we want to create correlated probabilities? We might look for some kind of multivariate generalisation of the beta distribution, one that can describe pretty flexible correlation between the variables. The generalised Dirichlet distribution allows us to describe correlated probabilities, however it has some restrictions on the support of the joint probability density function that...
Moments for a bivariate beta distribution
A common choice for a probability distribution of a probability is the beta distribution. It has the required support between 0 and 1, and with its two parameters we can obtain a pretty wide qualitative range for the probability density function. What should we do if we want to create correlated probabilities? We might look for some kind of multivariate generalisation of the beta distribution, one that can describe pretty flexible correlation between the variables. The generalised Dirichlet distribution allows us to describe correlated probabilities, however it has some restrictions on the support of the joint probability density function that...
May 10, 2017
Comparing E/MSY and Chisholm method
[Update: thoughts in this post contributed to Kristensen et al. (2020).] Historical data (e.g. sighting records) can be used to estimate historical extinction rates in a variety of ways. The Chisholm et al. (2016) method (earlier post) uses the data to estimate yearly extinction probabilities. The extinctions per million species-years (E/MSY) approach (Pimm et al., 2014) estimates they extinction probability averaged over species-years. Below, I use two small examples to illustrate the similarities and differences between them. Chisholm \(=\) E/SY when extinction constant Consider the example in the table below, where the extinction probability \(\mu_t\) is the same in every...Apr 28, 2017
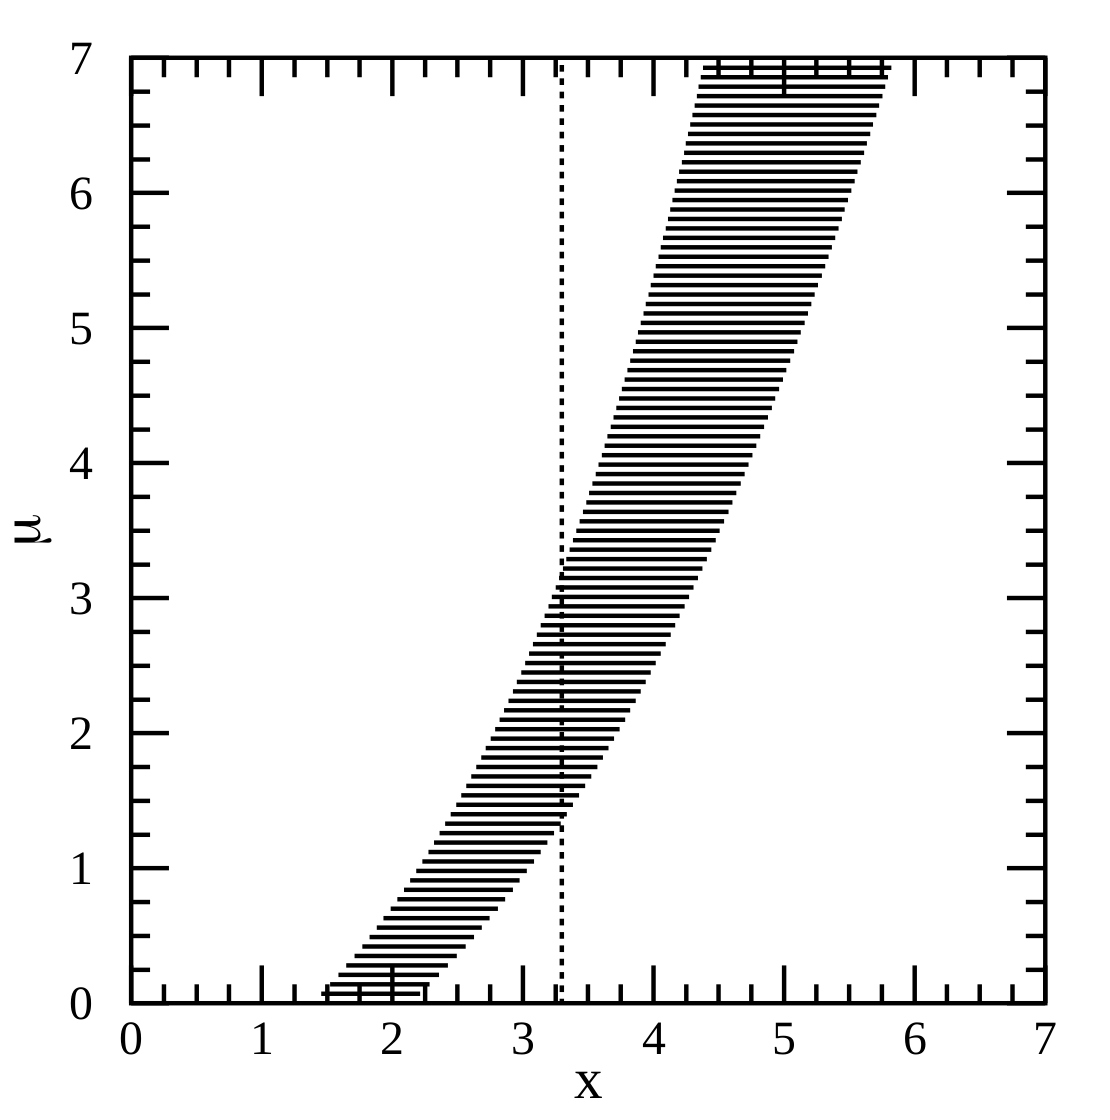 What is a confidence interval, really? We all learnt in undergrad how to find CIs for a standard distribution, but plugging numbers into equations never gave me a deep intuition for what was really going on. A worded definition is probably more helpful. Paraphrasing a bit from Wikipedia, we can think of the meaning of the confidence interval in terms of the procedure that we used to construct it. If this procedure for constructing confidence intervals is repeated on many samples, then the fraction of times that the true parameter value will fall within the different intervals will approach \(\gamma\)....
The method of confidence belts illustrated
What is a confidence interval, really? We all learnt in undergrad how to find CIs for a standard distribution, but plugging numbers into equations never gave me a deep intuition for what was really going on. A worded definition is probably more helpful. Paraphrasing a bit from Wikipedia, we can think of the meaning of the confidence interval in terms of the procedure that we used to construct it. If this procedure for constructing confidence intervals is repeated on many samples, then the fraction of times that the true parameter value will fall within the different intervals will approach \(\gamma\)....
Mar 31, 2017